
It’s been a difficult first half to the year, with stocks, bonds, precious metals and cryptocurrencies all suffering losses. Markets are dealing with issues like the COVID reopening, inflation, interest rate increases, the Russia-Ukraine invasion, and recession risk and there may be challenges ahead in the
near term.
The 5 charts below provide some reasons for optimism in the long term. As you have seen, this has been an extraordinary decline for markets. Extraordinary declines reset stock prices from “historically expensive” to “historically fair” which is healthier in the long run. Extraordinary declines are usually followed by stronger returns in the following five years. Here are some charts from JP Morgan in the US (and the data in Canada is similar) that present an optimistic viewpoint moving forward:
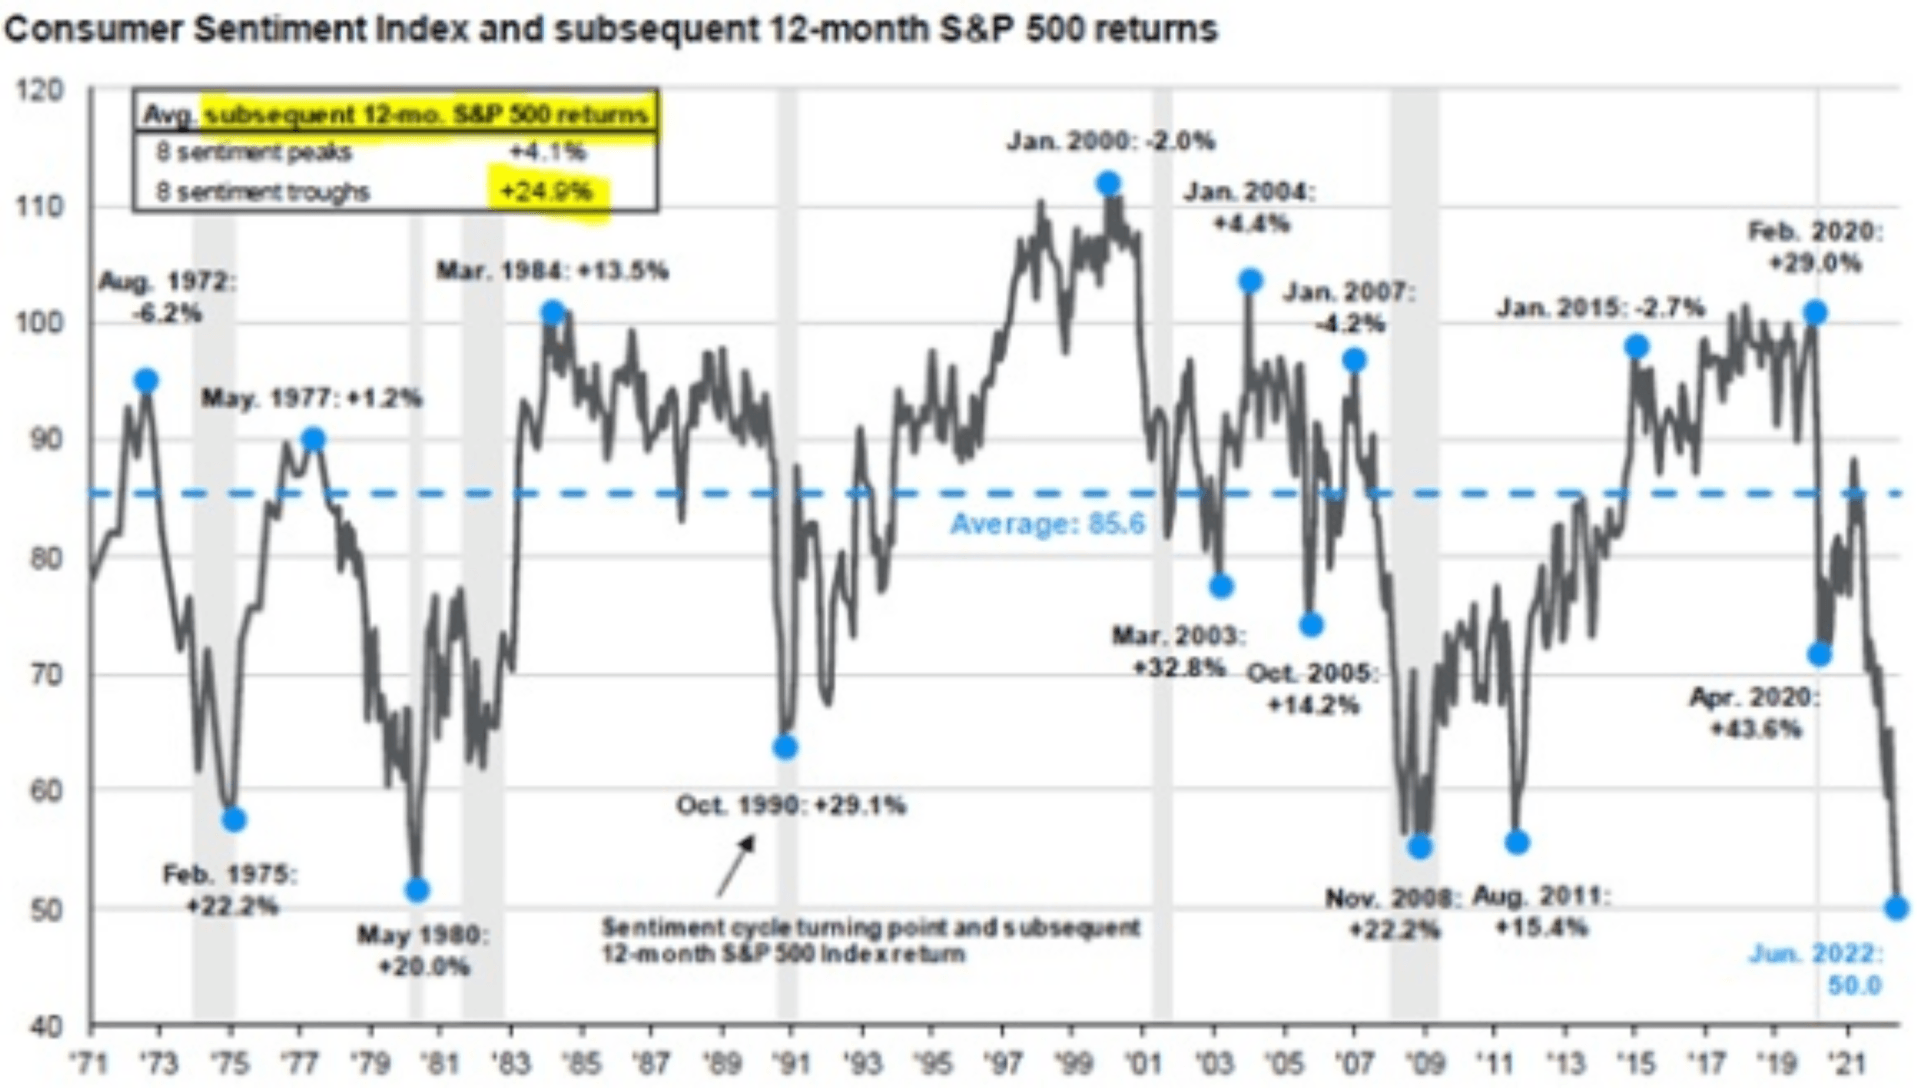
Consumer Sentiment
Consumer sentiment is an economic indicator that measures how optimistic consumers feel about their finances and the state of the economy. The current numbers are lower than during the Great Recession in 2008. The average 12-month stock market return from these sentiment bottoms is +24.9%. When consumer sentiment is high the average 12 month return is only 4.1%. That is why Warren Buffet has said it is wise for investors to be “fearful when others are greedy, and greedy when others are fearful".
Consumer Savings
American’s have over $2 Trillion of excess personal savings from COVID that remains unspent. And 70% of US GDP is from consumer spending.

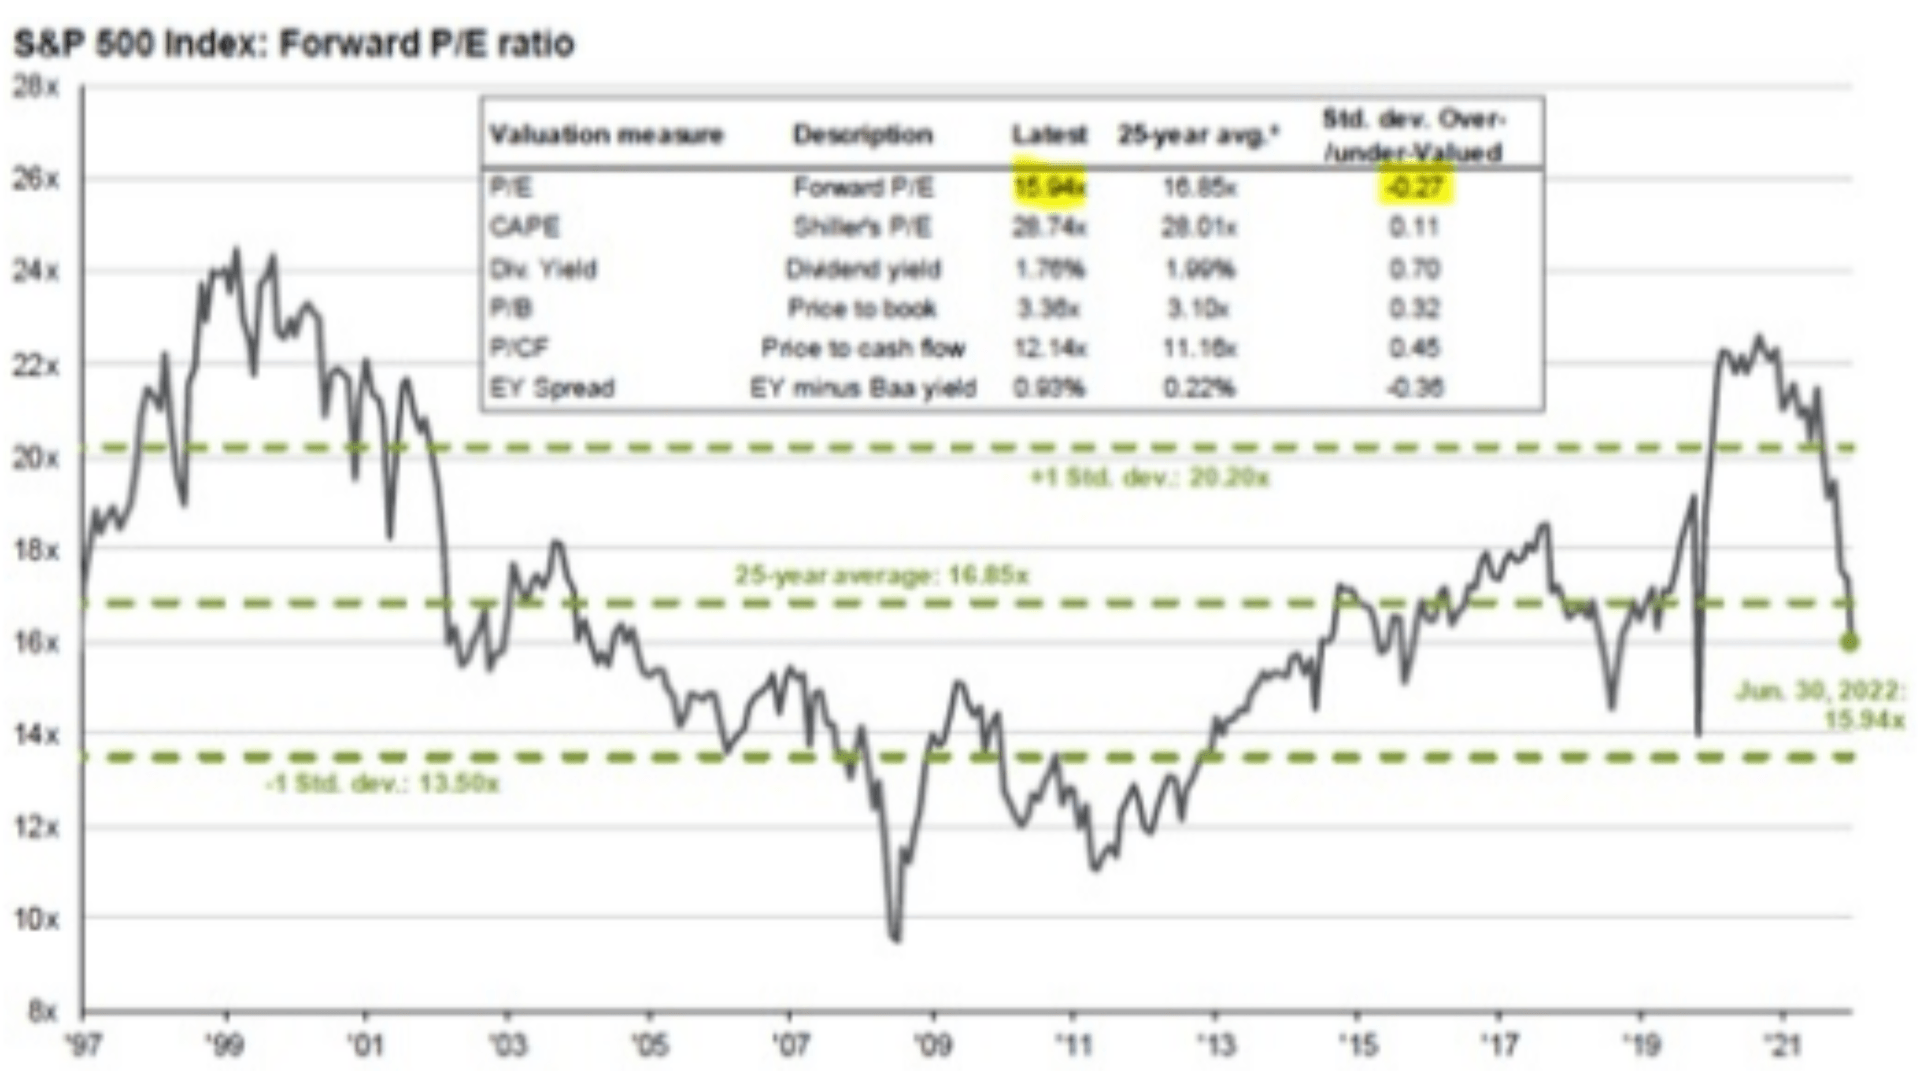
S&P 500 Valuation Measures
US Stocks dropped over 20% in the first half of 2022 as investors worried about inflation, interest rate increases and recession risks. This market correction has lowered the price to earnings ratio to 15.94x earnings, which is lower than the 25-year average of 16.85x earnings. This means that stock valuations are fair but are not considered “cheap”. This should set up investors for better returns in the long run, particularly if today’s stressful environment is eventually replaced by one of slow growth, low inflation and interest rates and high profitability reminiscent of the last decade.
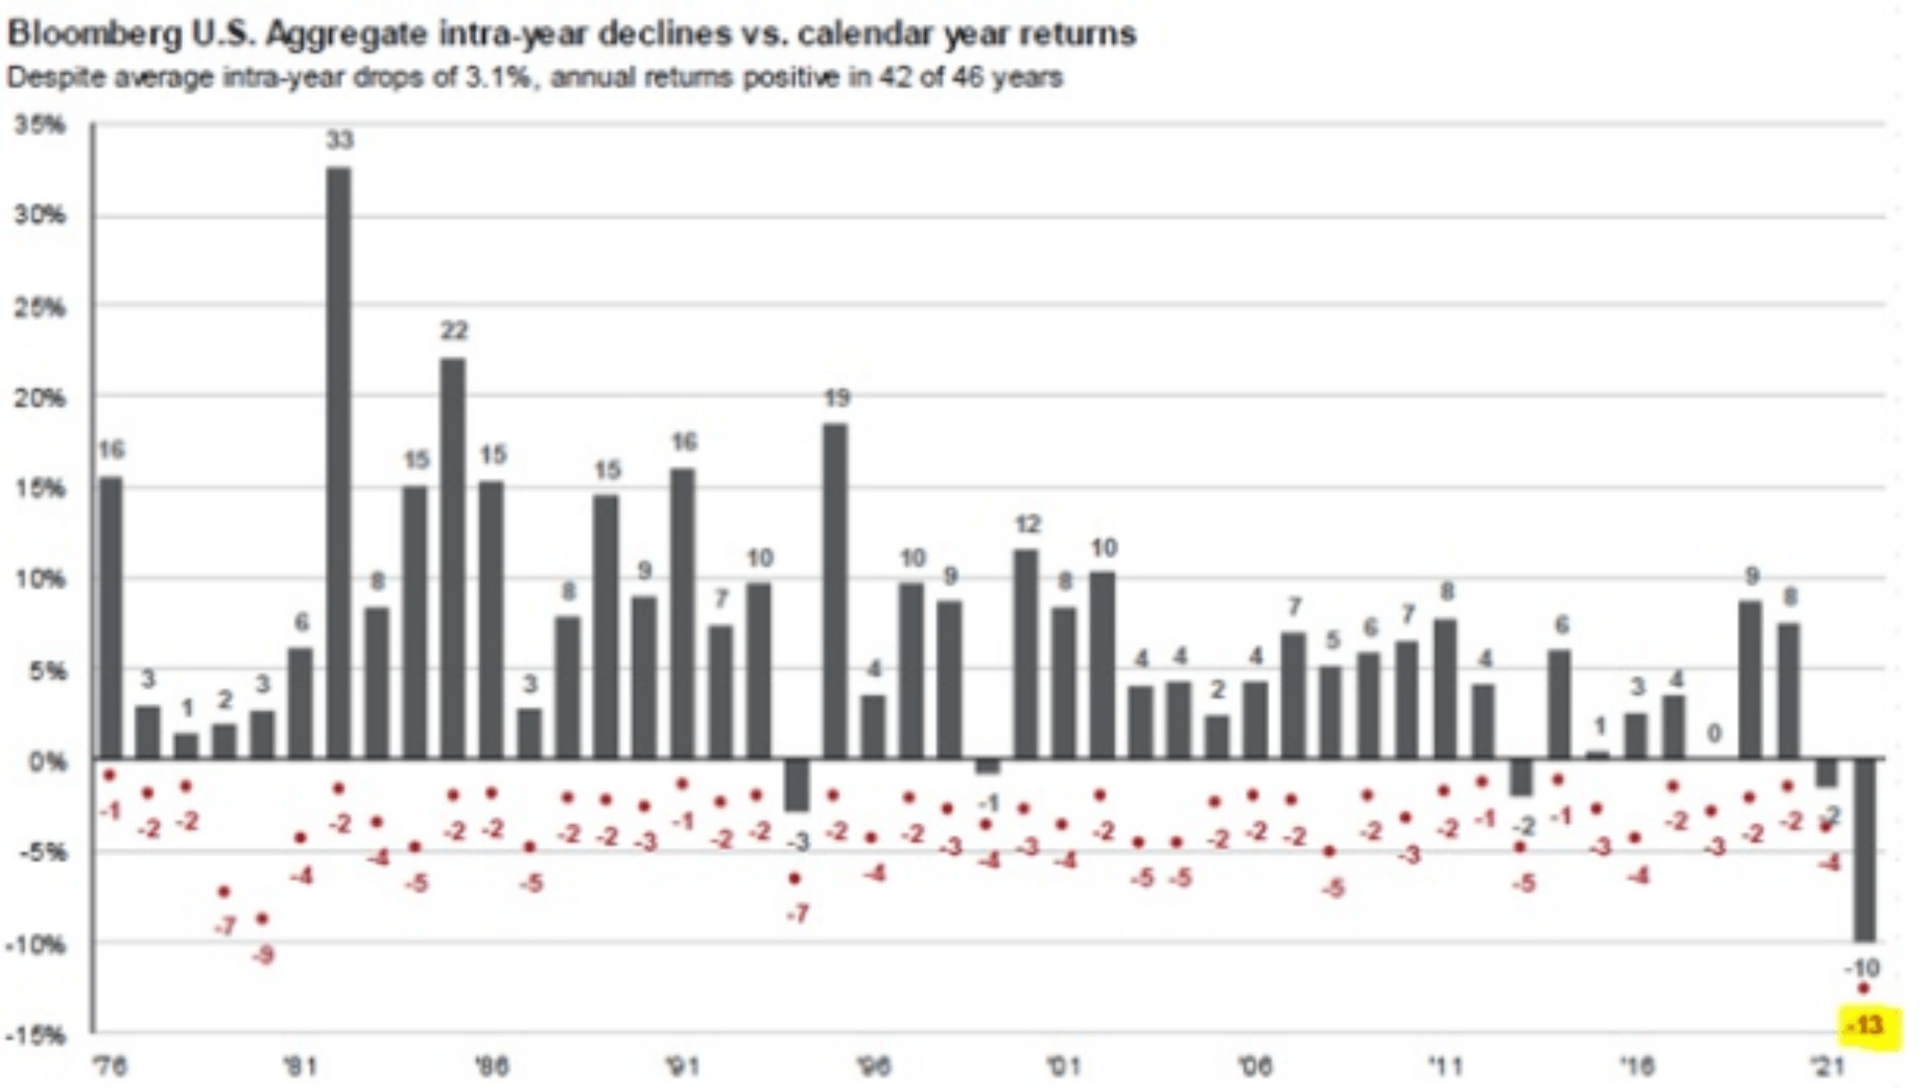
Fixed Income / Bonds
Bonds have gone through one of the worst periods in history. This shows the bond market lows in the past 46 years as well as the end result which has been positive for 42 of those years.
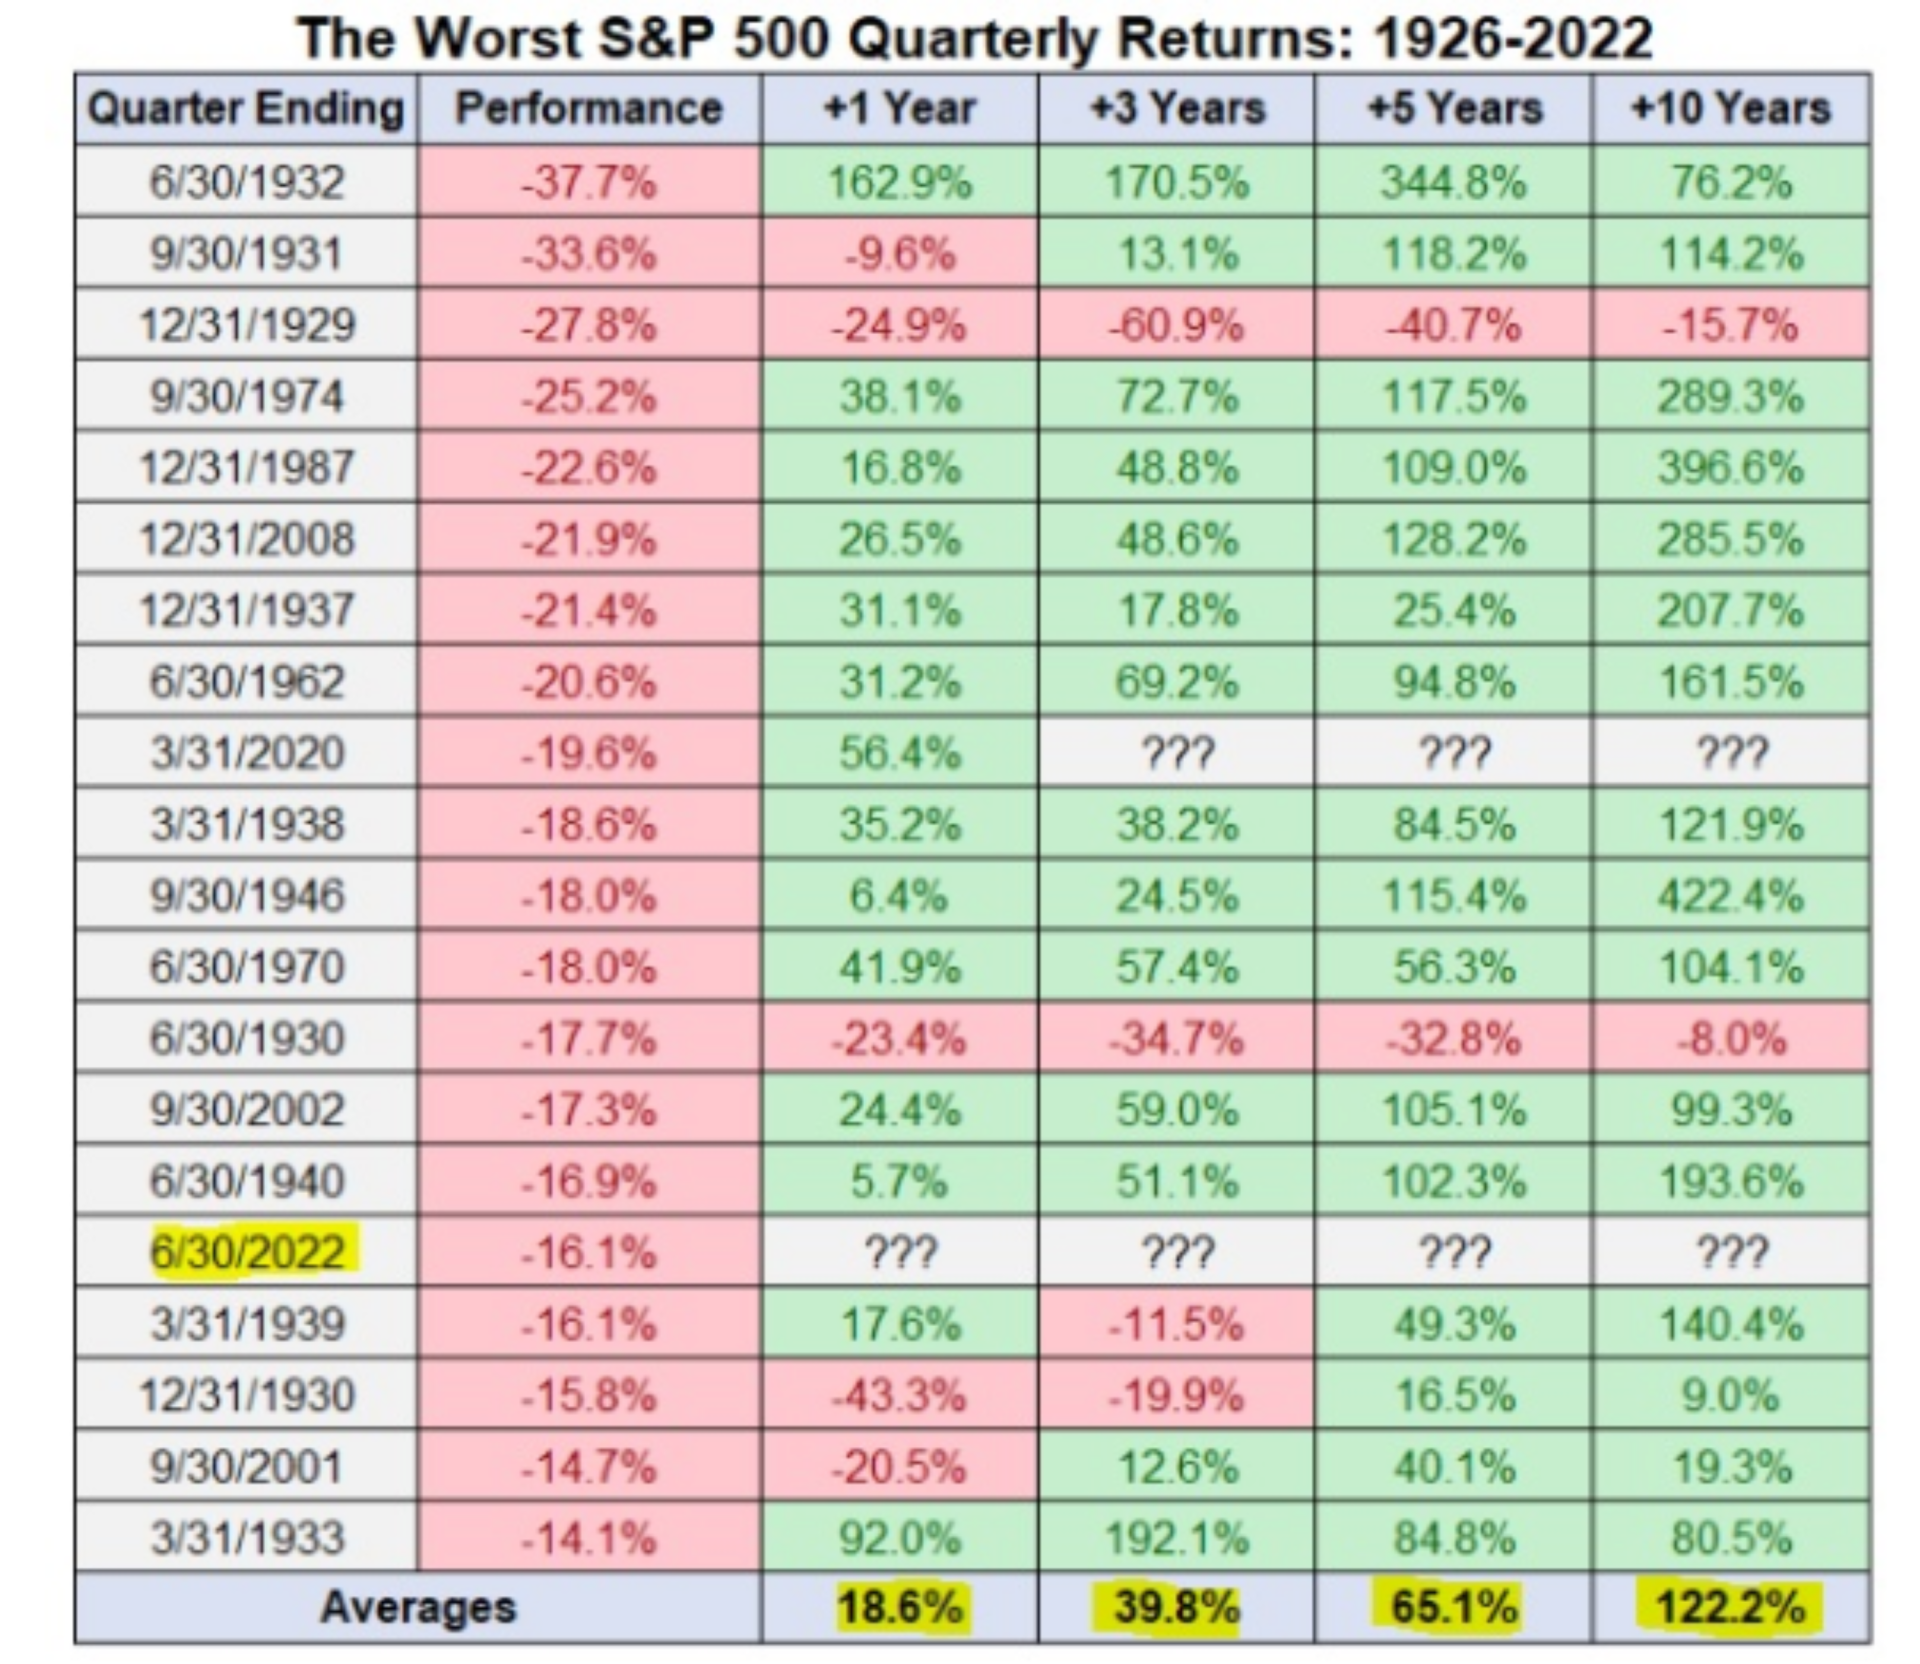
The Worst S&P 500 Quarterly Returns
Here, we see the S&P 500’s return history in various time periods following the worst quarters since 1926. The average annual return increases dramatically as time passes from these poor quarterly results. Over a long-term time horizon, your investment performance will mainly be derived from how you handle corrections, bear markets and market crashes.
We will leave you with some guidance from a TD Wealth Insights Report:
There’s no denying the current challenges, which are reflective of a late phase in the economic cycle. It’s going to remain challenging as economic growth slows and we move through this regime shift of rising rates. It’s important to always remember that the equity market is a discounting mechanism; current prices reflect expectations in the future, and expectations are for slowing growth.
Market volatility creates opportunities, but this is also a time to be selective and diligent. With that in mind, we remain focused on defensive positioning, value and quality companies that generate strong free cash flow and can grow earnings and dividends. In this environment, fundamentals and proper risk-factor diversification are especially important. While the current risk-off environment feels terrible, they have also brought the price of companies with strong attributes down to very attractive levels.
Remember, as an equity investor, you are an owner of businesses that will continue to sell their products, generate cash flow and pay dividends. We will continue to take a patient approach, focusing on compelling value ideas that offer attractive opportunities.
Thank you for your continued support, and please contact us if we can be of any assistance.
Sources: JP Morgan, TD Asset Management