

Equities Tumble, Higher Mortgage Rates, and Long-Term Treasury Yield Increases
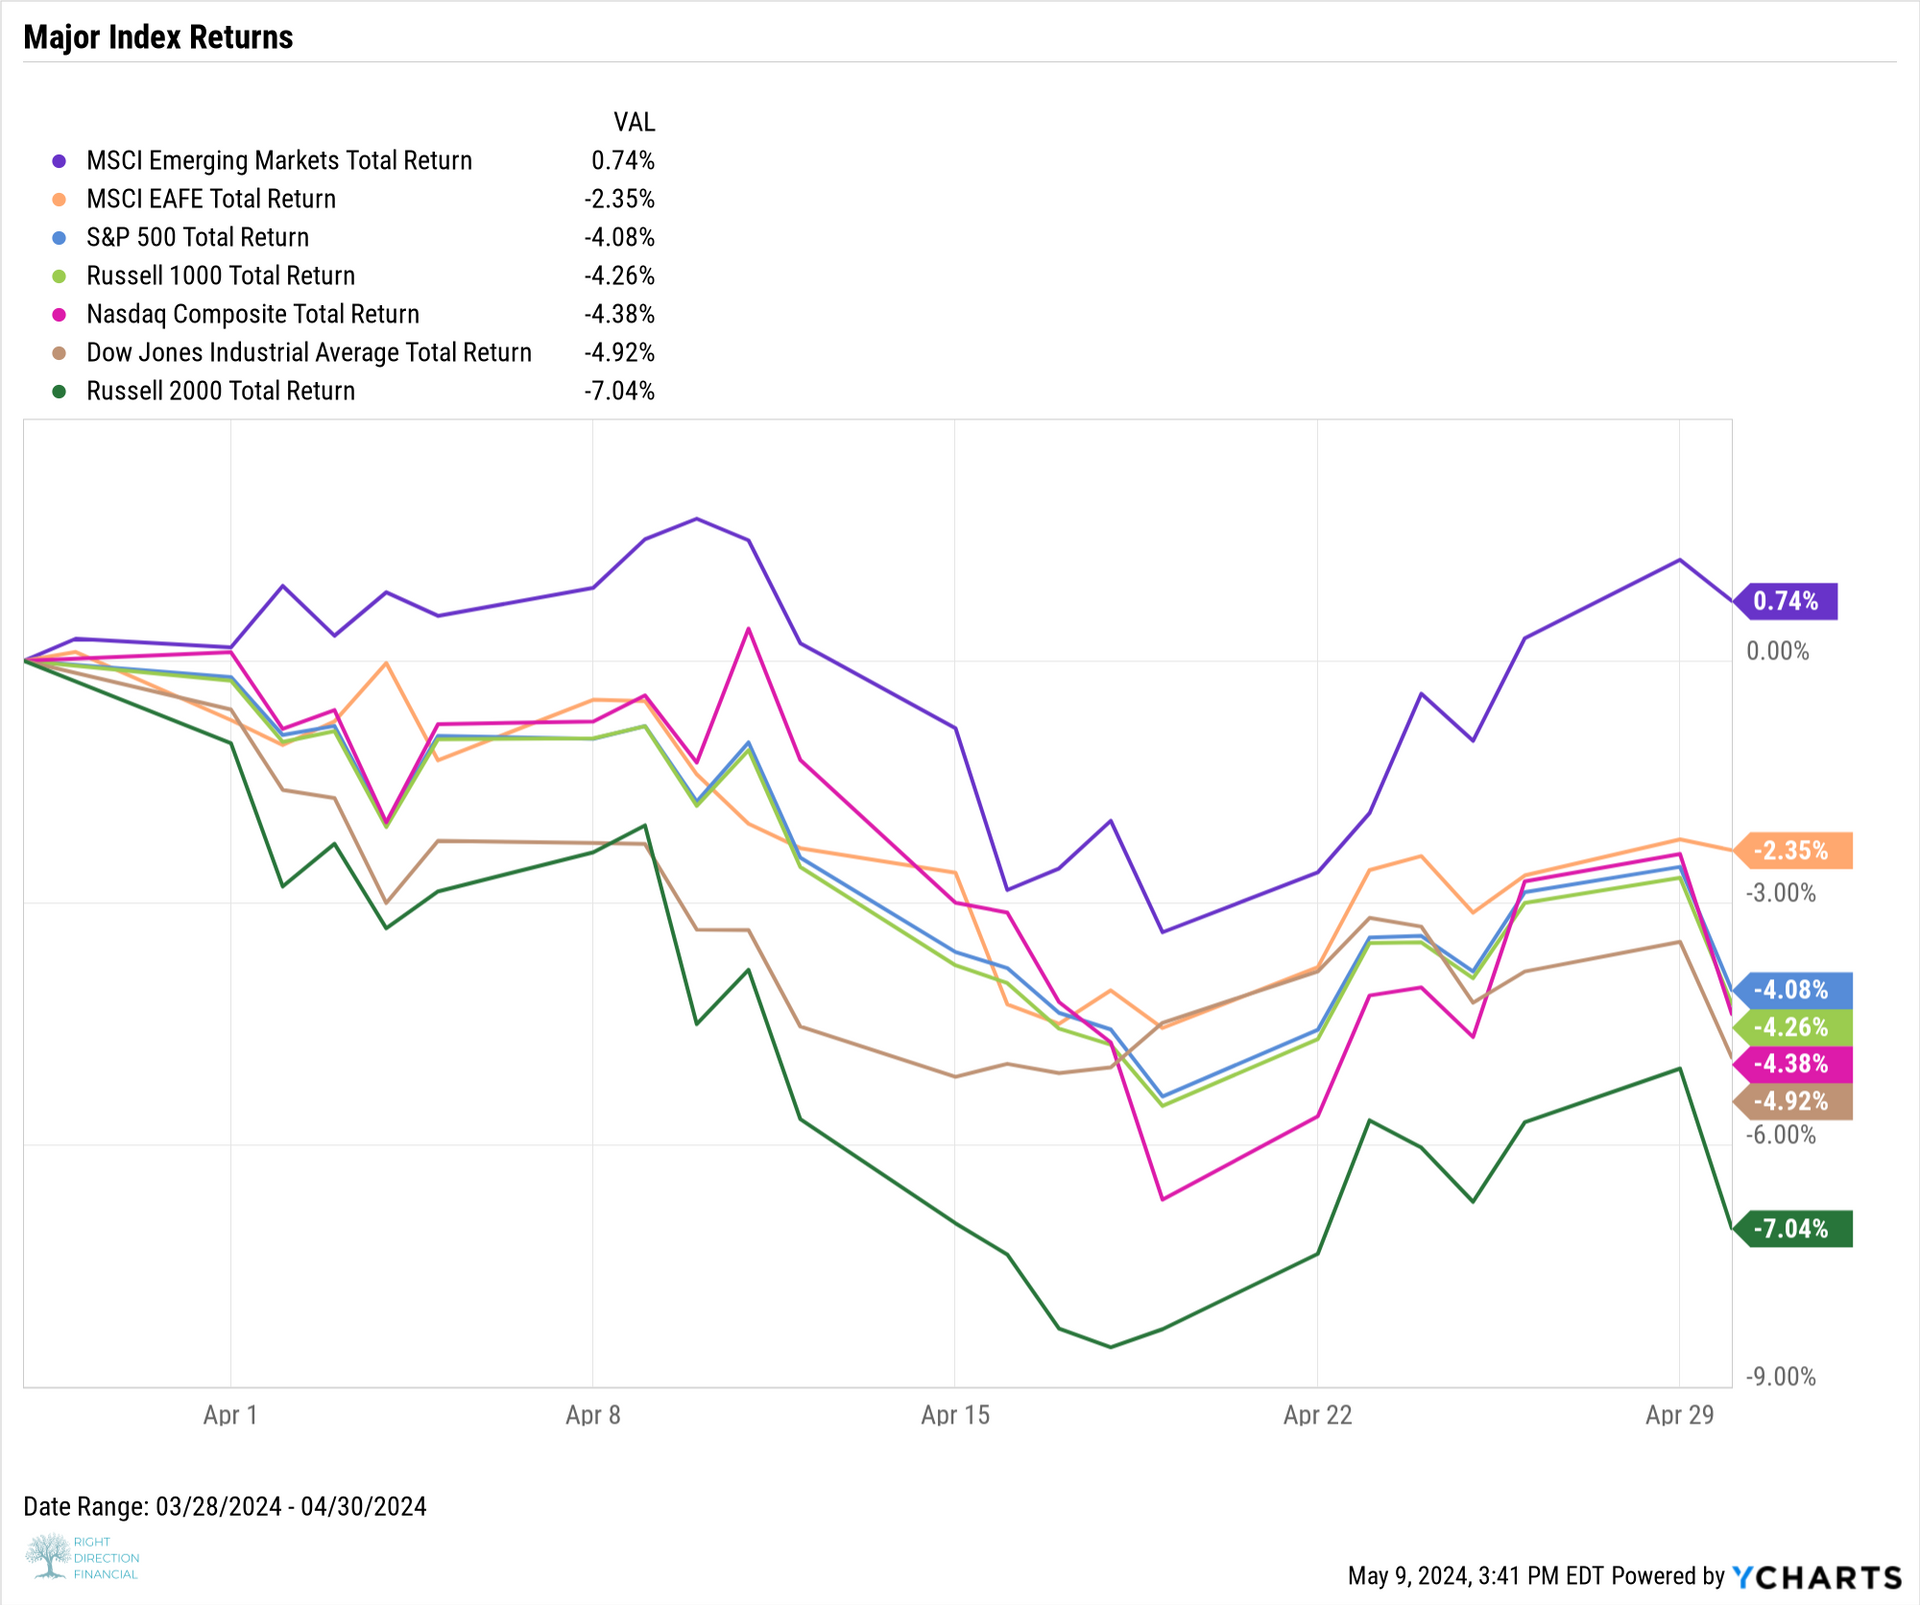
It's been a rough month for stocks following three straight months of gains. The S&P 500 fell 4.1% in its first monthly decline of 2024, the NASDAQ sank 4.4%, and the Dow Jones Industrial Average tumbled 4.9%. Emerging Markets was the only index on our chart (below) to post a positive gain in April. The Russell 2000 was the worst performer in April, plummeting 7%.
Only the Utilities sector was positive in April. Of the remaining ten sectors, Real Estate was the worst-performing sector, sinking 8.5%, followed by Technology and Health Care which fell 5.8% and 5.0%, respectively.
The 30-year mortgage rate surpassed 7% for the first time in 2024. Housing demand was mixed; new single-family home sales rose month over month but existing home sales fell. Bitcoin took its first breather of 2024, while the price of physical gold surged to a new all-time high.
Economic Data Overview:
Employment
March’s unemployment rate fell to 3.8% as the labor force participation rate increased to 62.7%. According to nonfarm payroll data, 303,000 new jobs were added in March, marking the first month of U.S. job gains since May 2023 and surpassing estimates that ranged from 150,000 to 250,000.
Consumers and Inflation
US inflation has now hovered in the 3-4 percent range for the last nine months, with March’s figure coming in at 3.48%. This was also the second consecutive monthly increase for YoY inflation. The Core Inflation rate for March was 3.80%, which continues to sit just below 4%. The monthly US Consumer Price Index rose 0.38% in March, and US Personal Spending’s MoM increase of 0.84% was the highest in 14 months. The Federal Reserve held its key Fed Funds Rate at 5.50% at its May 1st, 2024 meeting, marking the sixth consecutive meeting in which the Fed left rates unchanged.
Production and Sales
After posting an expansion reading for the first time since October 2022, the US ISM Manufacturing PMI fell 1.1 points to 49.20, putting it back into contraction territory. The Year over Year US Producer Price Index came in at 2.09%, the first time above 2% since April 2023, while February US Retail and Food Services Sales increased by 0.7% Month over Month.
Housing
US New Single-Family Home Sales surged 8.8% MoM in March, but US Existing Home Sales sank 4.3% Month over Month. Despite the slip in demand for existing homes during March, a strong month in February pushed the Median Sales Price of Existing Homes up 2.5% in March to $393,500. Mortgage rates increased slightly in April; the 15-year Mortgage Rate rose to 6.44% as of April 25th, and the 30-year pushed above 7% for the first time since December 2023, to 7.17%.
Commodities
The price of Gold advanced another 5.8% in April, to $2,343.10 per ounce as of April 26th amid geopolitical tensions, persistent inflation, a weakening dollar, and increased purchasing of the precious metal by central banks. Gold briefly topped $2,400 per ounce on April 12th. Crude oil prices increased slightly in April; the price of WTI ended April at $84.26 per barrel while Brent inched up to $88.44. Despite the muted activity in crude oil, the average price of gas increased 14 cents to $3.78 per gallon.
Cryptocurrencies
Cryptocurrency prices regressed in April. The price of Bitcoin dove 8.5% to $63,798 in April. Ethereum posted a similar decline, tumbling 8.4% to $3,214 in the month. Despite the breather Bitcoin and Ethereum took in April, the two have had a solid 2024 so far; Bitcoin is 51.1% higher, and Ethereum is up 40.1%.
As for Fixed Income, Yields on long-term Treasury bonds rose significantly in April. The 5-year Treasury note increased 51 basis points, the most of any duration on the curve. The 2-year, 3-year, 10-year, 20-year, and 30-year all increased by at least 45 basis points, while there was little activity on the shorter end of the curve.
Bond fund performance slumped as a result of the higher yields. The iShares 20+ Year Treasury Bond ETF (TLT) slipped 6.5%, the sharpest decline of any bond fund tracked on our chart (below).

Source: https://get.ycharts.com/resources/blog/economic-update-reviewing-q1-2024/