
Stock Market Update November 2022
On the heels of a huge month for stocks in October with major global equity indices returning mid to high single digits (with the exception of Asia and emerging markets) November has had some positive returns as well. Last week the S&P 500 had its best week since June and the NASDAQ had its best week since March.
Sparking much of the rally was news that inflation has likely peaked and is finally slowing.
Why does inflation peaking matter?
Well, if inflation does start to slow, then it opens the door for the US Federal Reserve and Bank of Canada to eventually stop their interest rate increases. They have increased interest rates significantly in a short time period and it does take time to feel the impact so they could back off further increases.
At this point, there are still a few more expected interest rate increases. As of last week, the markets have priced in a 100% chance of a 0.5% increase in December, 100% chance of a 0.25% increase in February, and 75% chance of a 0.25% increase in March, with no expectations of rate increases afterwards for the US Federal reserve.
Source: Manulife Investment Management
The other concern is whether or not the economy will go into recession and how severe it will be. The current thoughts are yes it will but because unemployment is so low, it should be a shallow recession. We all have to wait and see
At the same time the stock market is forward looking it has priced in a lot of ‘future’ bad news. Should we get any more good news on inflation, the war in Ukraine, or the economy, the rally could have plenty of legs left.
Manulife Investments believes that we’re getting much closer to the pause for interest rate increases and believe bonds/fixed income remains attractive for investing, especially in investment-grade quality bonds. For stocks, there may be more downside from these levels; trying to time the bottom of this market will likely lead to disappointment.
In this type of environment, dollar-cost averaging could be a potential strategy, and the strategy over the coming months is to prepare for the likelihood of a strong 2023.
The lower inflation number acts as a Pressure Release Valve
The softer-than-expected core inflation report was the catalyst for the S&P 500 Index gaining 5.5% on the day the inflation report was released, marking its best day since April 2020. The chart below shows some historical perspective for days that saw more than 5% gains. One year later, markets were up 91% of the time, with an average return of almost 28%.
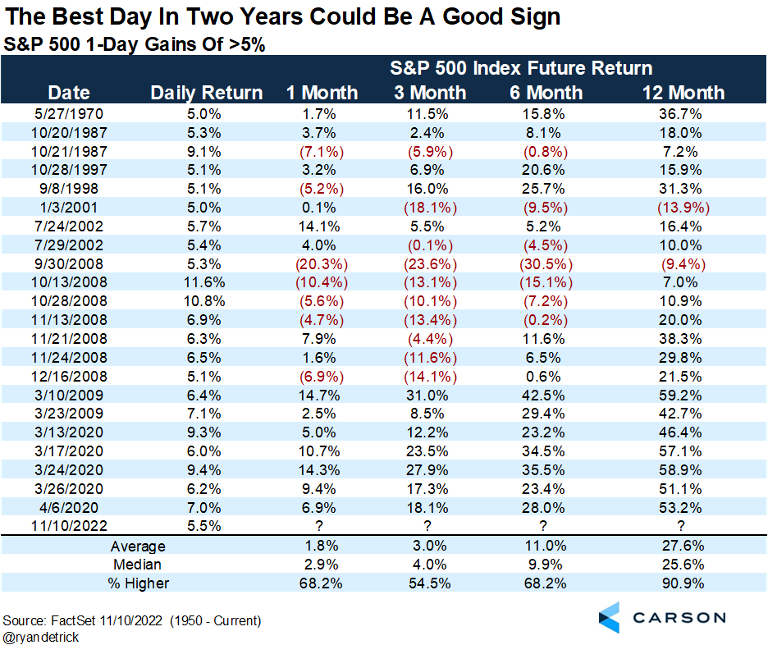
The market’s response shows how much negativity and expected hawkishness from the Fed has been priced in. This report was like a pressure release valve.
We Need Time, and the Inflation Data Bought Us Time
One month does not make a trend, but the October inflation report was still very positive. Several leading indicators have shown decelerating prices.
This report is important for two main reasons:
Firstly, the goods deflation in October offset the upward pressure from strong price increases in services.
Two, it buys time for the Fed. If this was yet another hot inflation increase, that would have put enormous pressure on the Fed to go for a bigger interest rate increase in December. But now it looks like a 50 bps increase is the most likely scenario, assuming the November CPI report doesn’t surprise us by coming in higher than expected.
How close are we to the market bottom?
During economic expansions, recessions, bull markets or bear markets, we’re often asked, “What inning are we in?” The market peak in this cycle happened on January 3 and we’re currently nearly 210 days into the current selloff. Since 1950, the average number of trading days it took from peak to bottom for previous bear markets is approximately 240 days. Using this as a starting point, perhaps we’re three-quarters of the way through this current bear market cycle.
Historically, there are typical indicators that are triggered before the market bottom. The Bank of America U.S. Equity & Quant Strategy team have done great work on these indicators. As of today, there are still indicators that need to be triggered, including unemployment rising vs its 12-month low, a 50-basis-point decline in the two-year yield (vs six-month low), and the yield curve steepening (vs six-month low), to name a few. Trying to time the bottom of this market will likely lead to disappointment. In this type of environment, we believe that dollar-cost averaging could be a potential winning strategy.
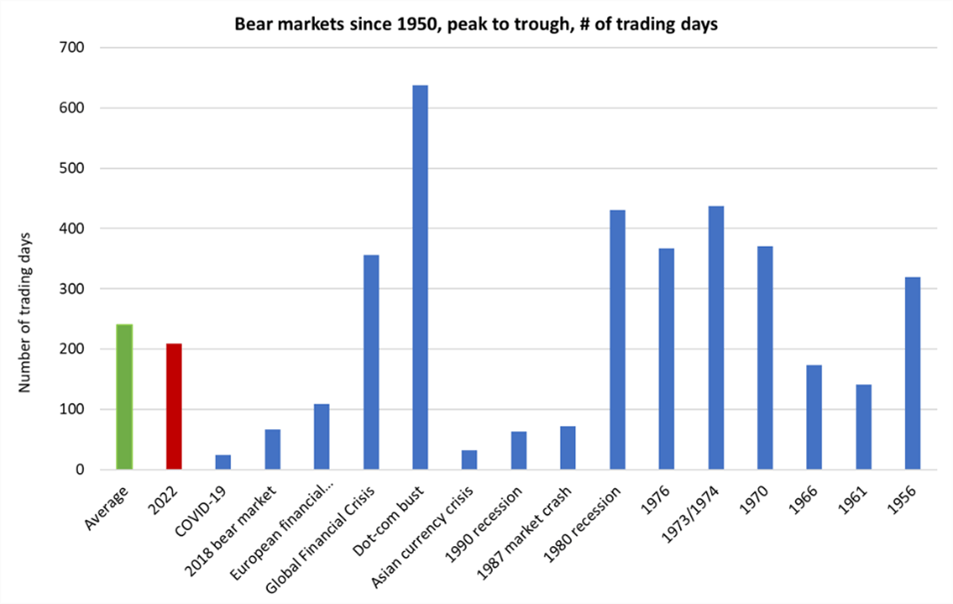
Source: Bloomberg, Capital Market Strategy, as of October 31, 2022. Green illustrates average and red illustrates 2022
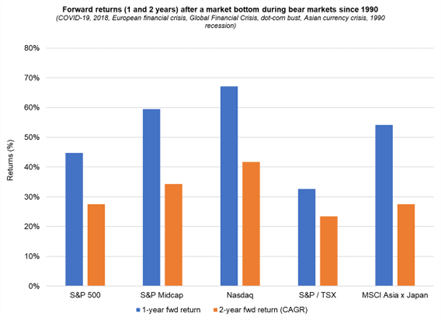
When markets bottom, what asset class recovers the fastest?
Once markets have bottomed, which equity asset classes have historically outperformed? We looked at the one-year and two-year compound annual growth rate (CAGR) forward returns from the bottom for the S&P 500, Russell 2000, Nasdaq Composite, S&P/TSX Composite, and MSCI AC Asia ex Japan indexes for previous bear-market bottoms since 1990. For reference, there’ve been seven. As the chart below indicates, Nasdaq and Russell 2000 traditionally do better from market bottoms vs their peers.
Market Results at Nov 18, 2022
S&P 500 -16.8%
TSX/S&P -5.9%
Source: Bloomberg, Capital Market Strategy, as of October 31, 2022